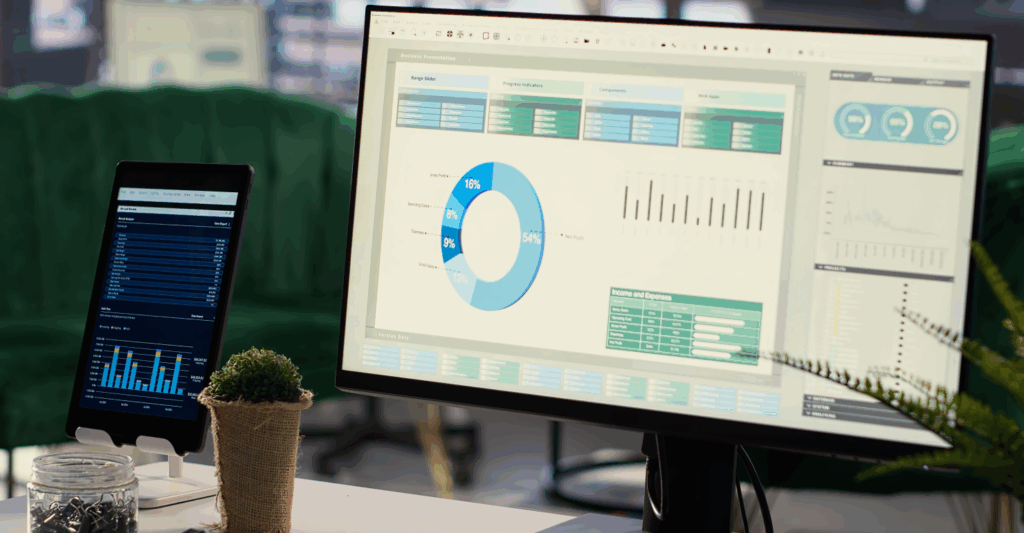
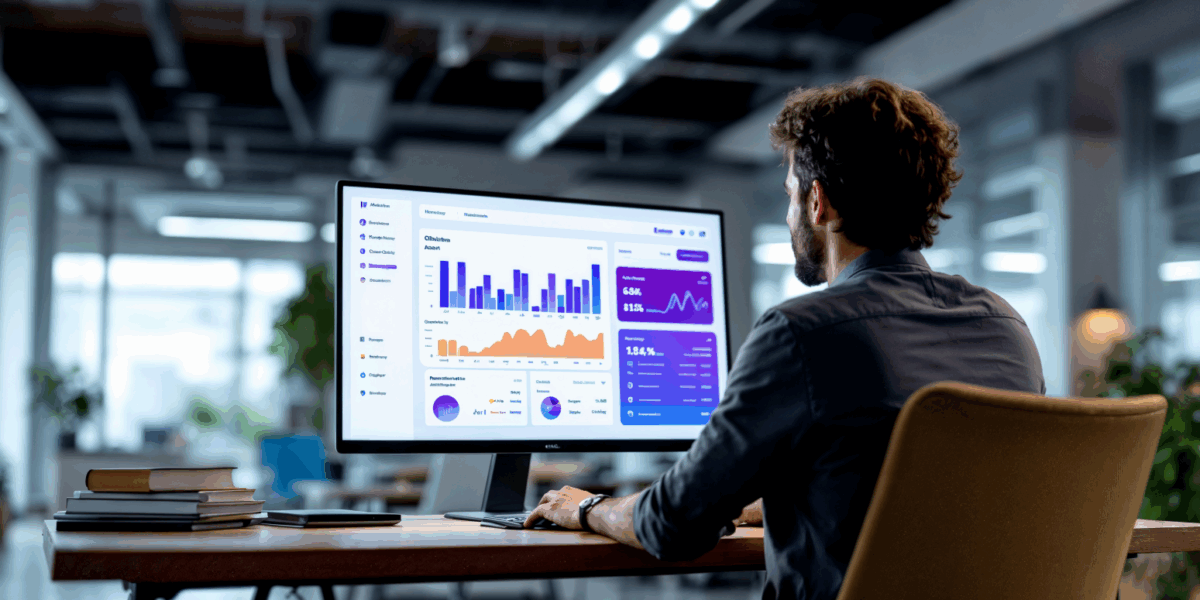
An executive dashboard is more than just a data collection of charts; it’s the control room of a business. It shows leaders whether the company is moving in the right direction or drifting off course. Instead of digging through endless reports, a well-designed executive dashboard highlights the KPIs that matter most to the C-suite, turning data into quick, confident decisions.
These dashboards are essential. A CEO may want to track revenue and growth trends, a CFO may need instant visibility into cash flow and margins, while a COO cares about operational efficiency. An effective dashboard ties all of these together into a single, decision-ready view.
This playbook will walk you through everything:
- What makes a dashboard truly “executive-grade”
- How to align KPIs with strategic goals
- The right visualization techniques to avoid clutter
- Architecture, governance, and adoption best practices
- Real-world examples across industries
By the end, you’ll know how to design dashboards that don’t just look good but drive decisions, improve business agility, and build executive trust.

What Makes a Dashboard “Executive-Grade”?
An executive dashboard is not about showing all the data—it’s about showing the right data in the simplest way possible. What separates a basic BI dashboard from an executive-grade dashboard is its ability to help leaders take action in minutes, not hours.
Here are the traits that define a strong executive dashboard:
- Focused on Business Goals: The best dashboards strip away noise. Instead of 20 different KPIs, they spotlight the five or six that actually influence C-suite decisions—revenue, cash flow, customer acquisition cost, operational efficiency, and risk exposure.
- Clear, Visual Storytelling: Executives don’t have time to interpret complicated charts. An executive dashboard design best practice is to use simple visuals that tell a story: line charts for trends, bar charts for comparisons, gauges for progress toward goals.
- Real-Time & Reliable Data: A dashboard loses its value the moment leaders doubt the numbers. Real-time updates and strong data governance make sure decisions are based on trustworthy insights.
- Accessible Anytime, Anywhere: Whether it’s on a laptop before a board meeting or on a smartphone in transit, an executive KPI dashboard should be responsive, mobile-friendly, and available on demand.
- Tailored to Each Role: The CEO, CFO, and COO all care about different metrics. The design should allow role-based views so every executive sees the data most relevant to them.
KPIs That Matter: Aligning Metrics With C-Suite Decisions
An executive dashboard is only as good as the KPIs it highlights. Too many numbers turn it into a cluttered report. Too few, and leaders miss the full picture. The sweet spot is choosing metrics that directly influence the decisions executives make every day.
Core KPI Categories Every Executive Dashboard Should Cover:
Financial KPIs (CFO Lens):
- Revenue growth rate
- Profit margins
- Operating expenses
- Cash flow status
These numbers help finance leaders understand if the company is financially healthy and sustainable.
Operational KPIs (COO Lens):
- Productivity and efficiency metrics
- Supply chain performance
- Project delivery timelines
- Cost per unit/service delivered
Operations executives use these to spot bottlenecks and improve efficiency.
Customer & Market KPIs (CMO / CRO Lens):
- Customer acquisition cost (CAC)
- Customer lifetime value (CLV)
- Sales pipeline progress
- Net promoter score (NPS)
These show how well the business is winning, keeping, and delighting customers.
Risk & Compliance KPIs (CRO / CIO Lens):
- Risk exposure levels
- Compliance status reports
- Data security incidents
- Audit readiness metrics
These indicators reassure leaders that the business is protected against risks and aligned with regulations.
Architecture & Performance Engineering for Dashboards
An executive dashboard may look simple on the surface, but behind it sits a complex BI architecture. If that foundation isn’t strong, the dashboard becomes slow and unreliable.
Here are the key architectural elements that make dashboards reliable and decision-ready:
- Data Integration & ETL Pipelines: Executives don’t care where data comes from; they care that it’s right and up-to-date. A solid ETL (Extract, Transform, Load) pipeline ensures data from CRMs, ERPs, finance systems, and marketing platforms is cleaned and unified before hitting the dashboard.
- Real-Time vs. Batch Processing: Real-time dashboards are Ideal for fast-moving KPIs like sales performance or risk monitoring. On the other hand, Batch dashboards are Suitable for strategic views like quarterly financials.
- Performance Tuning & Load Times: Executives need speed. A dashboard must load in under five seconds to stay relevant. Limiting visuals, pre-aggregating data, and using smart caching ensure smooth performance and keep decision-makers engaged.
- Security & Role-Based Access: Not all leaders need the same data. Role-based access ensures the CEO views company-wide metrics, while other executives see tailored insights, protecting sensitive information while keeping dashboards focused and clutter-free.
- Mobile-First Readiness: Executives make decisions on the go. Mobile-optimized dashboards with responsive layouts and touch-friendly design allow quick insights anytime, anywhere, ensuring leadership isn’t tied to a desk to stay informed.

Data Accuracy and Trust: The Backbone of Executive Dashboards
An executive dashboard is only useful if leaders trust the numbers. Once executives start questioning accuracy, adoption falls apart. That’s why data governance and trust must be built into the dashboard from day one.
- Data Quality Contracts: Executives expect accurate, consistent information. By setting clear data quality rules like validating entries, removing duplicates, and defining refresh intervals, you create confidence that every KPI displayed is reliable.
- Refresh SLAs (Service Level Agreements): A dashboard that shows outdated data is worse than no dashboard at all. Setting refresh SLAs (e.g., hourly for sales, daily for finance) ensures information is always decision-ready.
- Lineage and Auditability: Executives want to know where numbers come from. A dashboard that shows data lineage, the path from source system to visual, creates transparency and eliminates confusion about “which number is right.”
- Role-Based Governance: Governance isn’t just about accuracy; it’s also about security. Implement tiered access so each executive sees only what they need company-wide for the CEO, departmental for the COO, and marketing for the CMO.
- Compliance and Regulations: In industries like finance and healthcare, dashboards must comply with regulations. Embedding compliance checks ensures insights are not just useful but also legally safe.
The BI & Visualization Tools
Executive dashboards are only as strong as the tools that power them. With so many platforms on the market, it’s difficult to choose the right one for executive decision-making.
Power BI
- Deep Microsoft ecosystem integration, strong financial and operational reporting.
- Seamless with Excel and Azure, reliable governance controls, and mobile-friendly.
- Best fit: Enterprises already in the Microsoft stack.
Tableau
- Visual storytelling and design flexibility.
- Clean, easy-to-digest visuals that simplify complex data.
- Best fit: Organizations prioritizing intuitive data exploration and presentation.
Qlik
- In-memory processing for speed and associative data modeling.
- Real-time responsiveness and ability to link cross-functional KPIs.
- Best fit: Companies needing fast, interactive executive dashboards across departments.
Looker (Google Cloud)
- Cloud-native, scalable, and strong in embedded analytics.
- Easy integration with cloud services, role-based dashboards, and governance at scale.
- Best fit: Digital-first companies running on Google Cloud.
Key Takeaways
An executive dashboard is a decision engine. When built with the right KPIs, clear data visualization, and strong governance, it transforms raw numbers into quick, confident choices for the C-suite. Whether powered by Power BI, Tableau, Qlik, or Looker, the best dashboards share one trait: they keep executives focused on strategy.
By following executive dashboard best practices from choosing the right chart types to ensuring real-time, trusted data, leaders gain the clarity to act faster, cut risks, and stay ahead. Businesses that invest in executive-grade dashboards won’t just manage data better; they’ll unlock true agility and smarter decision-making.

